Every audit I run follows the same four-part diagnostic - whether it's a free listing audit or a full account review for a client. Below are real excerpts pulled directly from actual audits I've delivered: a UK home-goods brand, a wooden-bowl brand called Lexa, and a Canadian pool-supplies brand. The numbers, screenshots, and keyword ranks are unedited. This is what your account gets looked at through.
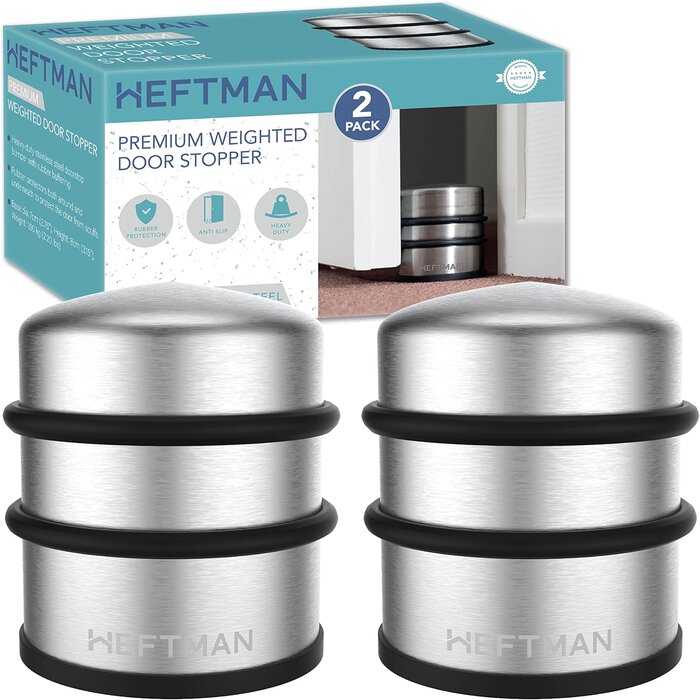
Before a single ad dollar is discussed, the listing itself has to convert the traffic it already gets. This is from a real Strategic Growth Report I delivered for a UK home-goods brand - stainless steel door stopper, sold under the storefront GOODS+GADGETS.
CTR is driven by the main image, title, price, and reviews. CVR is driven by the gallery, A+ content, bullet structure, and video. Every recommendation in the audit maps back to one of those two levers - nothing is suggested just because it "looks better."
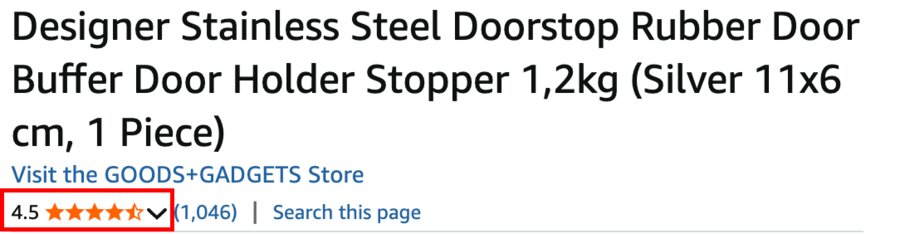
This listing sits at a 4.5★ rating with 1,046 ratings - a dangerous edge case flagged in the audit: if the true average slips to 4.4, Amazon's rounded star display drops from ~75% filled to ~25% filled. That single visual change hits CTR directly, so the fix isn't cosmetic - it's rewriting the listing content to set correct expectations before that threshold gets crossed.
The same audit mined the negative reviews for root causes and mapped each one to a specific content fix - not a generic "add better photos" note:
Then everything gets prioritized by actual revenue impact, not gut feel - this is the real action plan handed to that client:
Recommendation #2 above - "optimize main image" - didn't come from a hunch. It came from benchmarking real main images side by side and asking what a shopper actually sees in the half-second before they decide to click:

Two real listings pulled straight from the audit's main-image benchmarking, unedited - used to define what the client's own main image needed to communicate that it currently didn't: trust signals, scale, and use-context, all visible before a single click.

This section is from a brand audit I ran for Lexa, a wooden bowl brand. The hero product - Bamboo Salad Bowls - was doing real revenue, so the question wasn't "is it working," it was "where exactly is it leaking."
Real day-of-week sales split, Oct 14 – Jan 5 · Lexa brand audit. Sunday running 4% above every other day directly shaped when dayparting bids got increased.
Then keyword rank gets checked against search-query performance (SQP) - not just "are we ranking," but "should we be ranking here, and is the ad spend even pointed at the right term." Two real examples from the same audit, singular vs. plural search intent:
A 22 vs. 5 (or 77 vs. 7) rank gap between the singular and plural form of the exact same search intent is the kind of thing generic software flags as "keyword opportunity" - the audit's job is explaining why it's happening and which campaign structure fixes it.
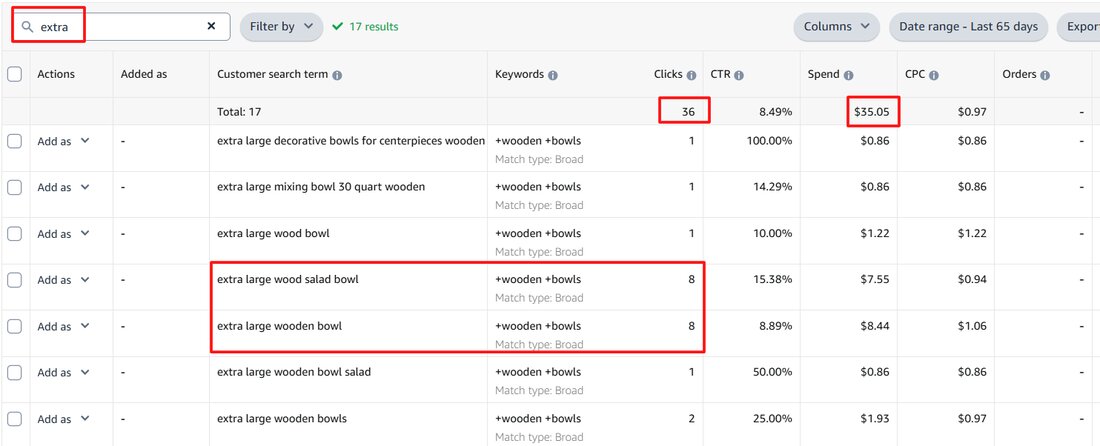
That single search-term report shows 36 clicks, 0 orders, $35.05 spent on search terms carrying "extra large" intent - a product that doesn't come in an extra-large size. That's not a hunch, it's a negative phrase decision made directly from the data.
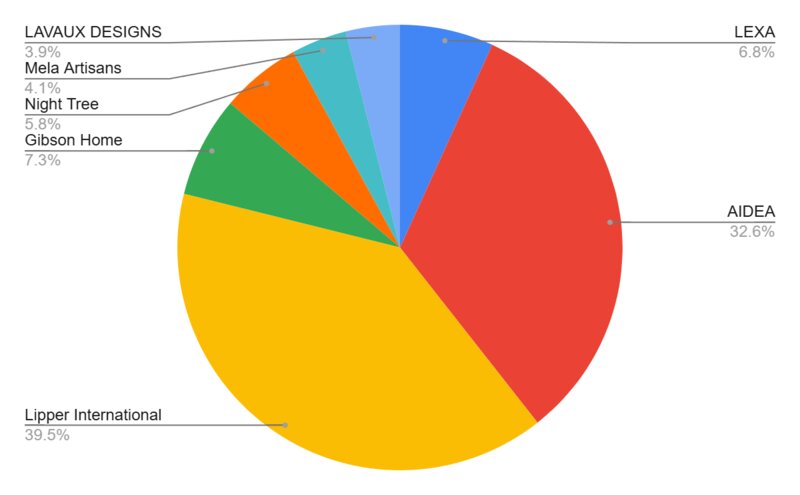
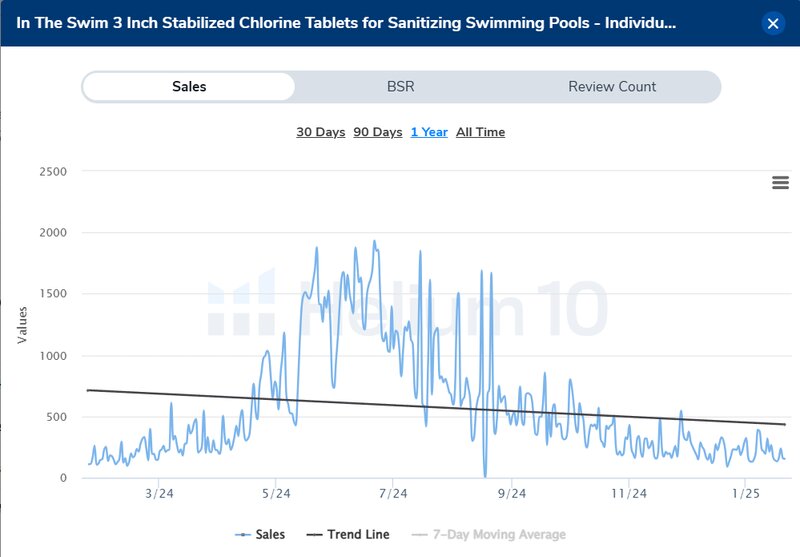
This is from a real market-entry audit for Pool Supplies Canada (marketed as Splash and Play) - evaluating whether their top Canadian product could expand into the US, and separately, tracking their actual TACoS discipline quarter by quarter.
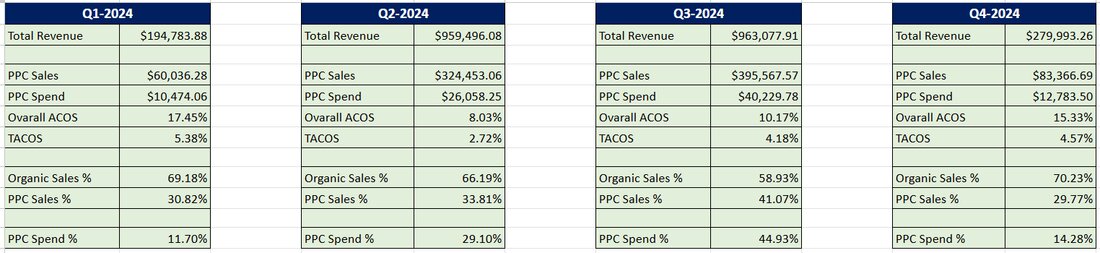
On the Canada side, this audit tracked real quarterly TACoS from the account's own ad console - the actual 2024 numbers:
TACoS by quarter, 2024 · Pool Supplies Canada ad console (estimated from available campaign data - Seller Board access wasn't available for this account).
The real finding wasn't the TACoS number itself - it was where the ad budget was actually going versus where the season said it should go:
Translation: spend was heaviest in Q3, after the ranking window had already passed, instead of in Q2 when organic ranks are actually won. That's a seasonal budget-timing fix, not a "spend more" fix.
Once an account has more than one or two products, the question stops being "how do we improve this listing" and becomes "which products deserve the next dollar of ad spend and content work, and which ones should be left alone or cut loose." That's a portfolio decision, not a listing decision - and it's where the BCG (Boston Consulting Group) growth-share matrix comes in. It was built in the 1970s for corporate business-unit planning, but the logic maps directly onto an Amazon or Walmart catalog: instead of business units, we're plotting ASINs or product lines.
The matrix has two axes. The vertical axis is market growth - is the niche this product competes in expanding or shrinking. The horizontal axis is relative market share - how strong this product's position is against the competitors already dominating that niche. On a corporate balance sheet those come from industry reports. On Amazon, we read them directly off the account and the tools already used in every audit above:
Every quadrant below is a real pattern from the three audits above - the matrix wasn't named in the original reports, but the decision logic is identical:
The point of running this on every multi-SKU account isn't the label - it's forcing the same question for every product before spending a dollar: is this a product worth reinvesting in, protecting, testing, or leaving alone? Skipping that step is how ad budget quietly ends up propping up a Dog while a real Star goes under-funded.