Case Studies · Zain Ali
Only 10 free audits a month, done personally by me. Spots fill fast.
Real numbers

Case studies, not claims.

No projected numbers, no "results may vary". Every figure below is pulled straight from Seller Central and dated.

6.8×
Revenue growth
GFA Sports, first period → latest
$468,000
Revenue driven
4Throws, $0 to now
8%
Avg TACoS held
Cozy, 5 straight months
Case study 01 · Launch from zero

GFA Sports client
GFA Sports
Sports & Outdoor · Launched June 2026

A brand-new account, one parent ASIN with 21 variations, zero sales, zero reviews, not indexed for its main keywords. Structured listing work and phased PPC, straight from the first two real reporting periods:

What we did, in order
1
Structure 21 variations under one parentConsolidated reviews and ranking authority onto a single listing instead of splitting it thin across 21 competing ASINs
Listing
2
Rewrite title & bullets around buyer psychologyProblem → solution → result structure, not keyword-stuffing
Listing
3
Launch & collect dataAuto + broad/phrase discovery campaigns, tight daily budgets while there's zero sales history to act on
PPC
4
Mine search terms weeklyConverting terms promoted to exact-match, everything wasting spend cut as a negative
PPC
5
Scale only what's provenBudget shifted only to campaigns already profitable, gradual bid increases for top-of-search
PPC
Read the full step-by-step case study →
First period
Jun 20 – Jul 20, 2026
Revenue $1,409.70
ACOS 50.74%
Net profit $1,123.61
Most recent period
Aug 1 – Aug 31, 2026
Revenue $9,632.95
ACOS 16.94%
Net profit $6,747.69

Source: GFA Sports' own Seller Central profit reports.

Revenuehigher is better
$1,409.70
First period
$9,632.95
Most recent
ACOSlower is better
50.74%
First period
16.94%
Most recent
Case study 02 · Niche category growth
4Throws
Track & field competition equipment · $0 to $468,000

4Throws sells competition discus equipment - real demand, but nowhere near the search volume of a mainstream category, so ranking discipline matters more than raw ad budget. Same 3-phase system as the free PPC playbook, applied to a real account:

The 3-phase system
1

Launch phase: rank first, ignore ACOS

Single-keyword ranking campaigns on the exact match terms that mattered most, accepting a high early ACOS to buy top-of-search placement and real review velocity.

2

Weekly search term harvesting

Every converting search term promoted to its own exact-match campaign, every zero-order term cut as a negative, compounding weekly instead of set-and-forget.

3

Expand phase: defend the brand

Once ranked, budget shifted toward brand defense and product-targeting campaigns, so competitors couldn't buy traffic off 4Throws' own branded searches.

Launch
Rank first, ignore ACOS
Harvest
Weekly search-term mining
Expand
Defend the brand
$468,000
Revenue driven since launch - $0 to now, running the same 3-phase system as the free PPC playbook.
REAL ACCOUNT

Watch the walkthrough above to see the real Seller Central account behind this number, start to finish.

Case study 03 · Ongoing management
Cozy
Electronics · USB & cable dust caps · Active account, month-to-month

Not a launch story, an ongoing-management one. Cozy is a real, already-live account: five straight months of Seller Central profit reports, consistent revenue and consistent profit, no lucky spike.

~8%Avg TACoS
~$4.7KAvg monthly net profit
4.7★Review rating

Ad spend held to roughly 8% of revenue every month, right in line with the account's own 8.73% internal target - proof the system holds steady over time, not just in a good month.

$18,227 $12,621 $12,669 $13,598 $13,523 Month 1 Month 2 Month 3 Month 4 Month 5

Exact monthly figures: $18,227.05 · $12,621.30 · $12,668.97 · $13,598.32 · $13,522.59 - pulled directly from Seller Central profit reports.

Real accounts, numbers unaltered

What growth actually looks like on the accounts we run

Pulled straight from Seller Central. Brand names are withheld for client confidentiality. The figures, and the screenshots below them, are exactly as reported.

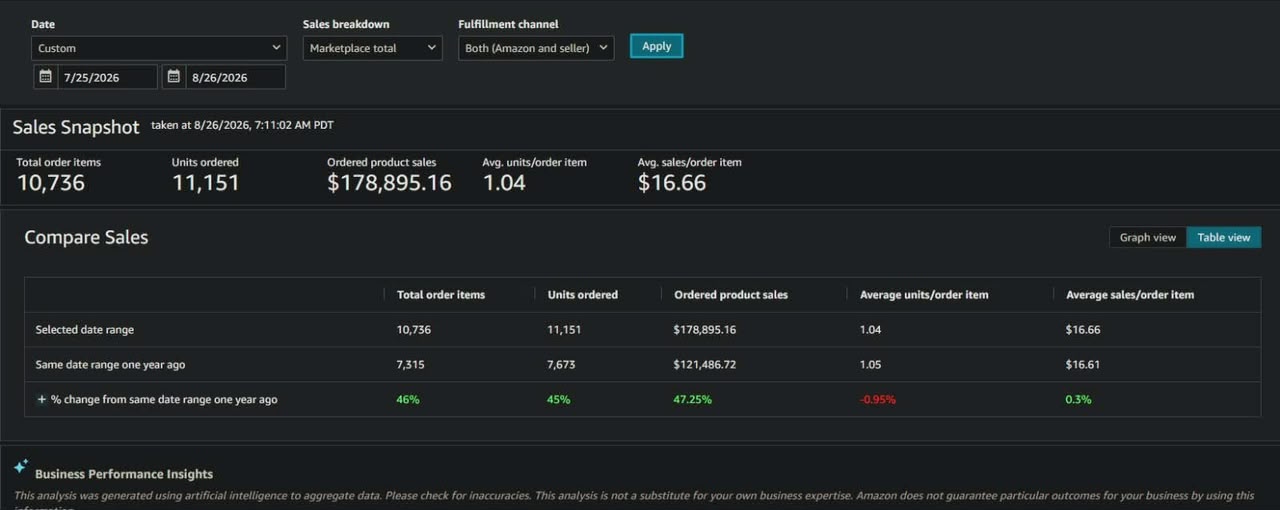
Account A · Monthly snapshot
Jul 25 – Aug 26, prior year $121,486.72 7,315 orders · 7,673 units
→
Jul 25 – Aug 26, this year $178,895.16 10,736 orders · 11,151 units
+47% sales · +46% orders YoY

Rebuilt the PPC account structure and sharpened match-type targeting to convert existing traffic more efficiently, then layered in listing optimization to lift conversion rate.

Seller Central Compare Sales report backing Account A's numbers View full screenshot
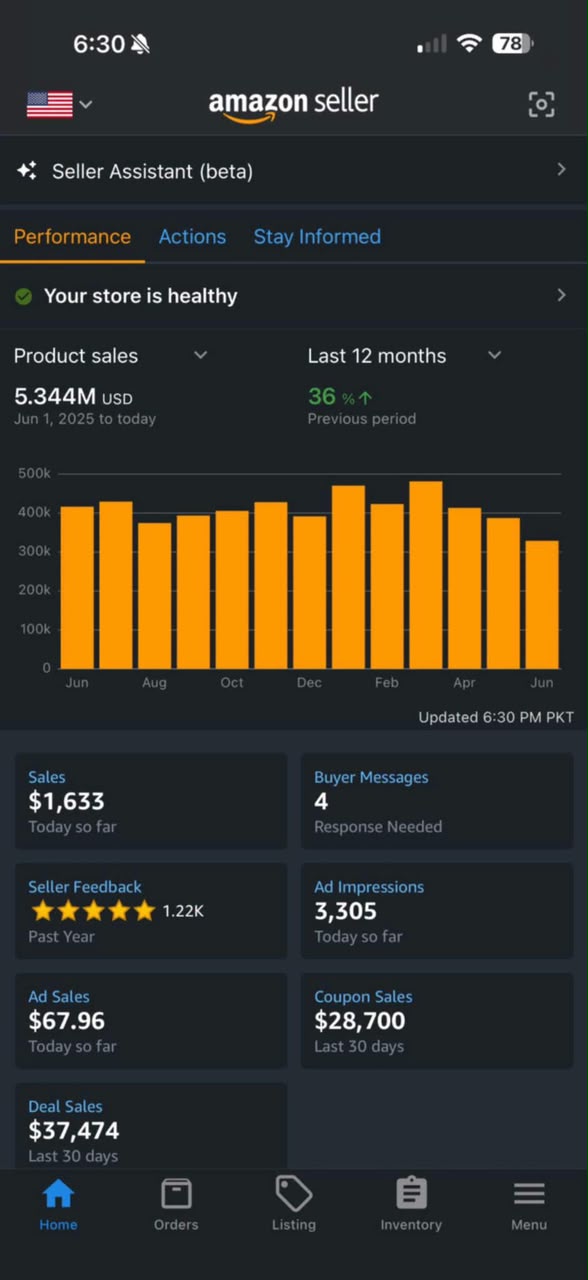
Account B · Trailing 12 months
Prior 12 months $3.93M
→
Trailing 12 months $5.34M
+36% YoY

Focused on catalog health and keyword indexing across the existing SKU portfolio, paired with tighter inventory planning to keep best-sellers in stock through peak demand.

Seller app 12-month product sales report backing Account B's numbers View full screenshot
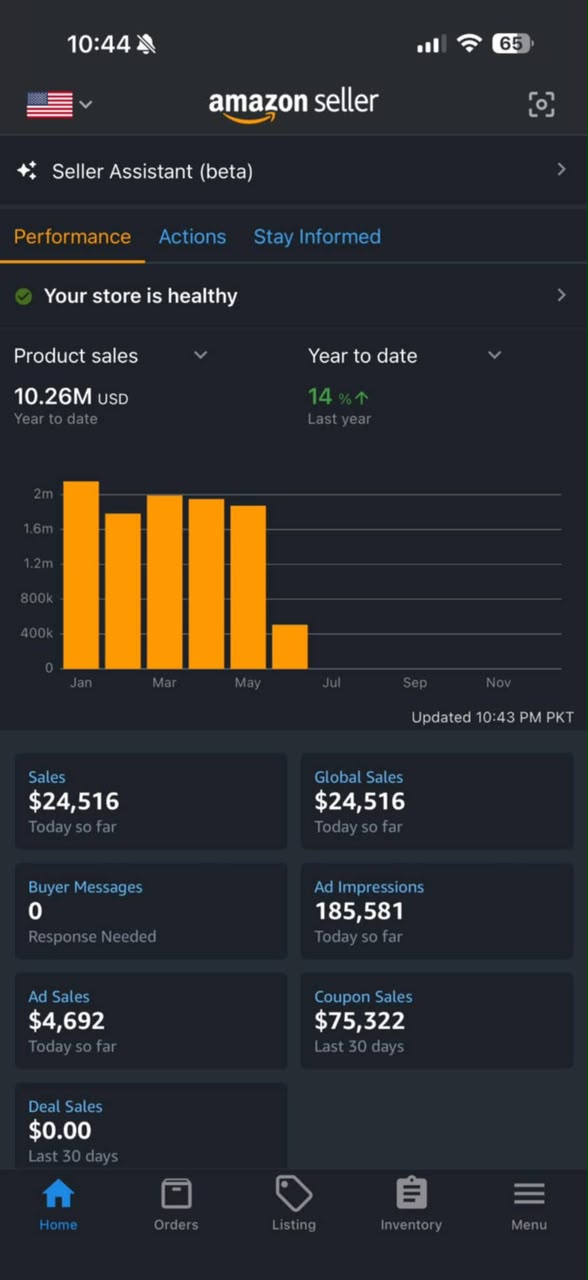
Account C · Year to date
Same period, prior year $9.00M
→
Year to date $10.26M
+14% YoY

Ran a full creative and listing refresh (updated imagery, A+ content and backend search terms) to improve click-through and conversion on already-strong traffic.

Seller app year-to-date sales report backing Account C's numbers View full screenshot
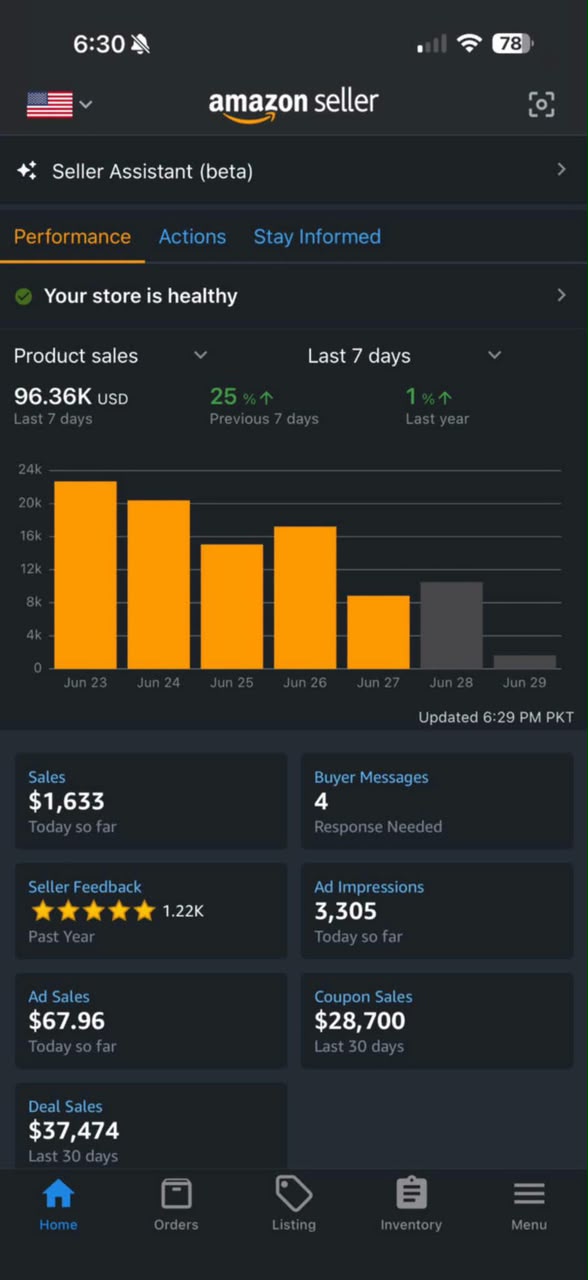
Account D · Weekly momentum
Previous 7 days $77,090
→
Last 7 days $96,360
+25% week over week

Tightened PPC bid efficiency and dayparting around the account's highest-converting windows, compounding week-over-week sales momentum.

Seller app last-7-days sales report backing Account D's numbers View full screenshot
Curious how the numbers above get made?

See the actual audits behind these results.

These case studies show outcomes. The methodology page shows the diagnostic work underneath them - the same PPC, listing, and competitive analysis used on GFA, 4Throws, and Cozy above, demonstrated on three other real client audits with the data left in:

Keyword rank gaps
Rank 5 vs. 22 between singular and plural search intent - the same rank-diagnostic method used to find GFA's early keyword opportunities.
Seasonal budget timing
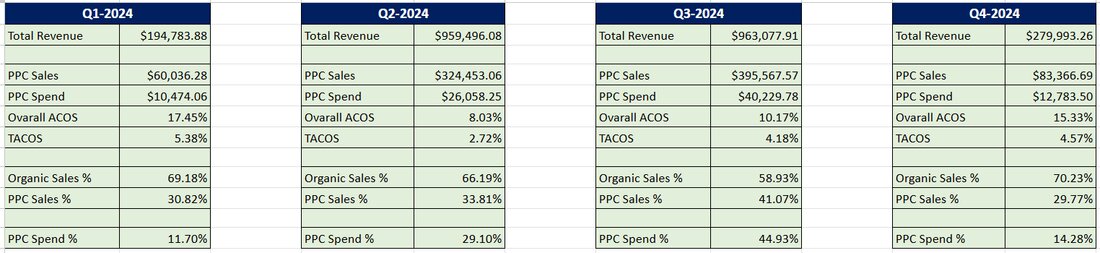
A real account spending 44.93% of its budget after the ranking window had already closed - the same seasonality logic behind every launch timeline above.
Review-risk threshold
A listing sitting at 4.5★, one tenth of a star from a visibly worse star display - the same review-protection thinking behind Cozy's 4.7★ being actively defended, not left to chance.
Portfolio prioritization
The BCG matrix used to decide which products get the next ad dollar - Star, Cash Cow, Question Mark, or Dog, explained with real account examples.

A few of the real, unedited excerpts this is built on:

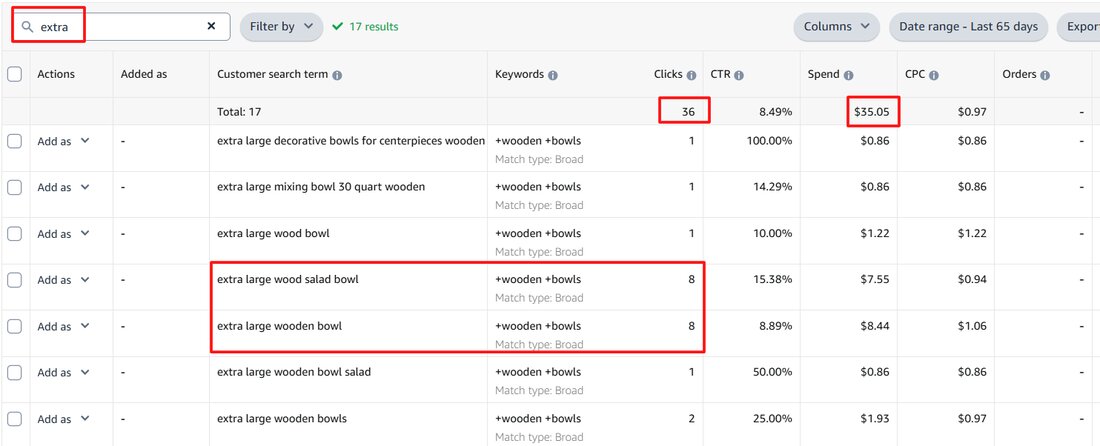
Real Amazon Ads console search term report used in a client audit
Ads console search-term report$35.05 spent on non-converting intent, found and cut
Real Amazon Brand Analytics SQP report
Brand Analytics SQP dataConversion share measured keyword by keyword
Real quarterly TACoS spreadsheet table
Quarterly TACoS breakdownReal ad-spend allocation, quarter by quarter
Scroll to see more
See the full methodology →

Want results like this?

Book a free audit or start a launch, and let's find out what's actually possible for your account.

Want results like this?Let's find out what's possible.
Get in touch
Free downloads

Get all 3 Amazon playbooks, free.

$597 in value. Apply the PPC system today and start seeing results this week.

  • The Amazon PPC Playbook - launch, expand, harvest
  • Private Label Sourcing Masterclass
  • FBA Product Research Masterclass
No spam. Just the 3 guides and occasional strategy notes.
Check your downloads. All 3 playbooks should be downloading now - and check your inbox too.
Free playbooks